


Ghost Networks in Healthcare: What They Are and How To Address Them
Ghost networks have increasingly become a central topic of discussion within the healthcare sector and legislative circles. As this issue gains attention, it is crucial to understand the implications of...
Increase the Value of Your Physician Network
4 Steps to Increase the Value of Your Provider Network Build a High-Performance Physician Network Given the increasing demand for public access to accurate information, healthcare organizations are looking to...

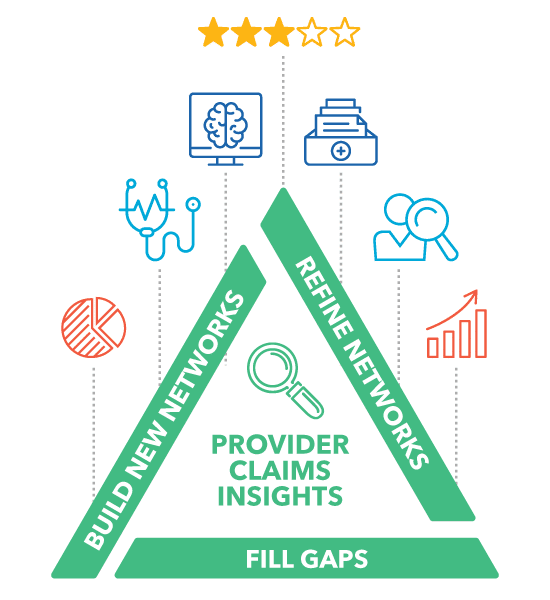
How Provider Claims Insights Can Improve Your Provider Network Management
As an insurance provider, your primary goal is to connect your members with reliable and available healthcare services. So, it’s frustrating when you try to do so but end up...
Six Provider Performance Measures
Infographic: Six Provider Performance Measures for Network Optimization How Provider Claims Insights Can Transform Your Provider Selection Download the Infographic Now Building a comprehensive and efficient provider network is more...
How to Improve Provider Network Performance
The foundation of an effective provider network lies in selecting the right providers, those whose capabilities match the clinical needs of your member population. But for payers and health plans,...
How to Efficiently Expand Your Healthcare Provider Network
Expanding your footprint is an exciting opportunity for your business, but it also comes with its fair share of challenges. One of the main hurdles is quickly and efficiently finding...

Episode: Next Generation Structured Provider Network Strategies
Listen on: Spotify Apple Youtube Episode: Next Generation Structured Provider Network Strategies Date: April 5, 2024 Guests: Steve Levin, CEO, Quest Analytics® | Connect on LinkedIn Jim Brown, Vice President...
Ghost Networks in Healthcare: What They Are and How To Address Them
Ghost networks have increasingly become a central topic of discussion within the healthcare sector and legislative circles. As this issue gains attention, it is crucial to understand the implications of...
Increase the Value of Your Physician Network
4 Steps to Increase the Value of Your Provider Network Build a High-Performance Physician Network Given the increasing demand for public access to accurate information, healthcare organizations are looking to...
How Provider Claims Insights Can Improve Your Provider Network Management
As an insurance provider, your primary goal is to connect your members with reliable and available healthcare services. So, it’s frustrating when you try to do so but end up...
Six Provider Performance Measures
Infographic: Six Provider Performance Measures for Network Optimization How Provider Claims Insights Can Transform Your Provider Selection Download the Infographic Now Building a comprehensive and efficient provider network is more...
How to Improve Provider Network Performance
The foundation of an effective provider network lies in selecting the right providers, those whose capabilities match the clinical needs of your member population. But for payers and health plans,...
How to Efficiently Expand Your Healthcare Provider Network
Expanding your footprint is an exciting opportunity for your business, but it also comes with its fair share of challenges. One of the main hurdles is quickly and efficiently finding...
Episode: Next Generation Structured Provider Network Strategies
Listen on: Spotify Apple Youtube Episode: Next Generation Structured Provider Network Strategies Date: April 5, 2024 Guests: Steve Levin, CEO, Quest Analytics® | Connect on LinkedIn Jim Brown, Vice President...